You're viewing phase one of the GeoNet beta site. Features and content may change.
Read this news article to find out what's happening.
www.geonet.org.nz continues to run as usual.
Earthquake Drums
Earthquake drums display real-time ground motion recorded by seismometers across Aotearoa New Zealand.
They help show when and where earthquakes are occurring and how the ground is moving.
On this page, you can view live drum plots, understand what they show, and track recent seismic activity.
Seismograms
The most common means of displaying seismic monitoring data is called a seismogram. Traditionally these were
drawn by ink on paper, but today are usually created by computers using digital data. GeoNet seismograms of
National Network sites can be seen here.
How do I read a seismogram?
You read a seismogram like you are reading these words; the earliest time is at the top left and then goes along the
line to the end and then starts at the left of the next line. The top-left is therefore the oldest data and the
bottom-right the most recent. All the seismograms shown in these pages cover a 24-hour period.
Why can't I see the ground moving; why is the image static?
The seismograms shown on the GeoNet website do not display 'real-time' data. The volume of data required to be sent
across the internet to show the ground as it moves is too great to display all the seismograms in 'real-time'. Instead,
each seismogram is produced every 5 minutes and the web page updated as each new image becomes available. If you want to
keep track of changes over a period of time remember to hit the 'refresh' icon on your browser every so often.
What is the resolution of the seismograms?
GeoNet seismographs typically record the ground movement 100 times a second. To download a seismogram at this resolution
from a web page would take a long time, even using fast broadband. To reduce the download time we draw a seismogram that
displays only one data point each second. You can see the main features of a seismogram, but not all of the detail.
GeoNet scientists use these seismograms for a 'quick look' at what is happening and make other kinds of seismograms if
they want to look in more detail.
What else do the seismograms show?
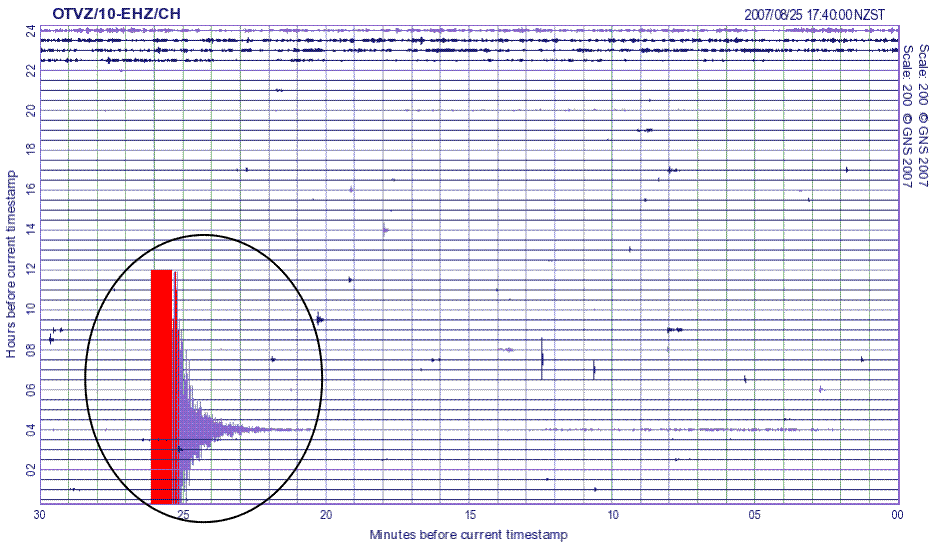
The label on the top-left of the seismogram in Fig. 1 (i.e. OTVZ/10-EHZ/CH) says exactly which seismograph's data are
shown (see the FAQ). On the top-right is the time of the most recent data (i.e. 2007/08/25 17:40:00 NZST).
On the right side is the plotting scale (i.e. Scale: 200) and along the left and bottom are the time axes.
Hide caption
Figure 1: A seismogram showing a typical earthquake.
Are all seismograms plotted at the same scale?
No. Some sites are noisier than others and tend to be plotted at a scale that shows a smaller signal (these sites have a
larger scale number). To plot these sites at the same scale as nearby, quieter sites would result in a seismogram completely
blue (or red) and would show no useful information.
Earthquakes
An earthquake typically shows as a signal that is much larger than that of the normal background.
What does an earthquake look like?
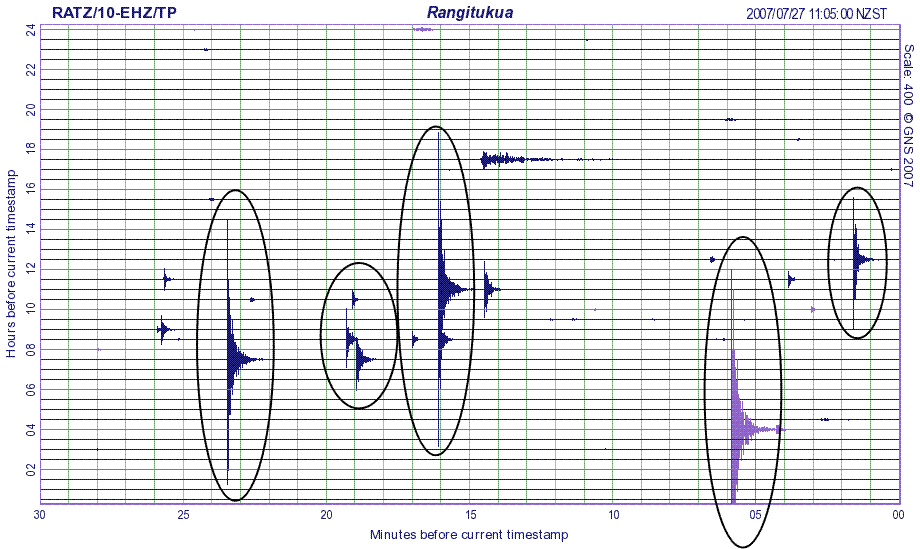
A nearby earthquake usually has a very sudden onset and decays away relatively quickly - usually less than 5 minutes
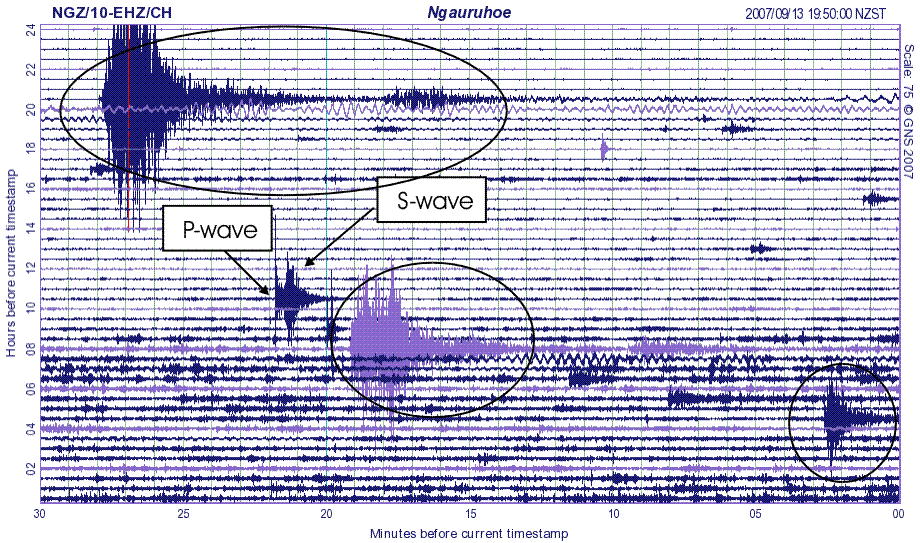
(see Fig. 2). With a more distant earthquake you may be able to see both the P- and S-waves (see Fig. 3) and the earthquake
decays away more slowly. Because of the limited resolution of the seismograms you cannot always see both the P- and S-waves,
especially for nearby earthquakes.
Hide caption
Figure 2: Earthquake signals are typically larger than background noise.
Hide caption
Figure 3: Example of P- and S- waves, other earthquakes are circled.
What do the 'red bits' mean?
A seismogram is coloured red if is clipped, i.e. the largest parts of the signal are not shown. If this was not done then
a large earthquake would obscure much of the seismogram from view. So if the signal is red, the real size is larger than
is shown on the seismogram.
Swarms
In the central North Island volcanic region (Ruapehu to the Bay of Plenty coast) earthquakes frequently occur as swarms.
What is an earthquake swarm?
A swarm is a sequences of many earthquakes, usually in a short time period (hours to days), without a single clear largest
event. Swarms are often seen on seismograms from monitoring sites at or near the volcanoes.
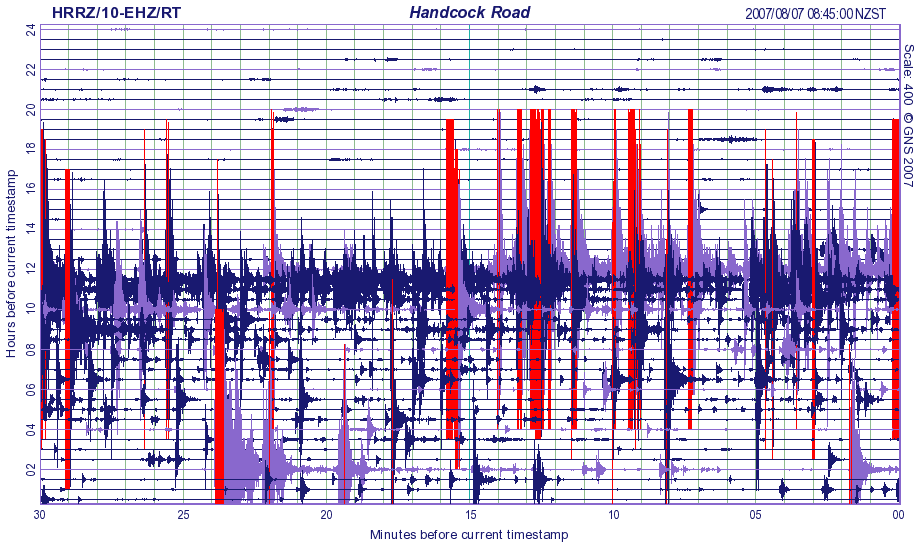
The seismogram in Fig. 4 is from Handcock Road (a site between Taupō and Rotorua) shows a typical earthquake swarm,
starting at about the 12 hour mark and continuing until the end of the plot. The larger of the earthquakes would be
locatable, and some of those probably felt nearby.
Hide caption
Figure 4: An example of a earthquake swarm.
Noise sources
The main noise sources on seismograms are wind and vehicle traffic.
What about noise sources?
The main noise sources on seismograms are wind and vehicle traffic, and this makes volcano monitoring difficult.
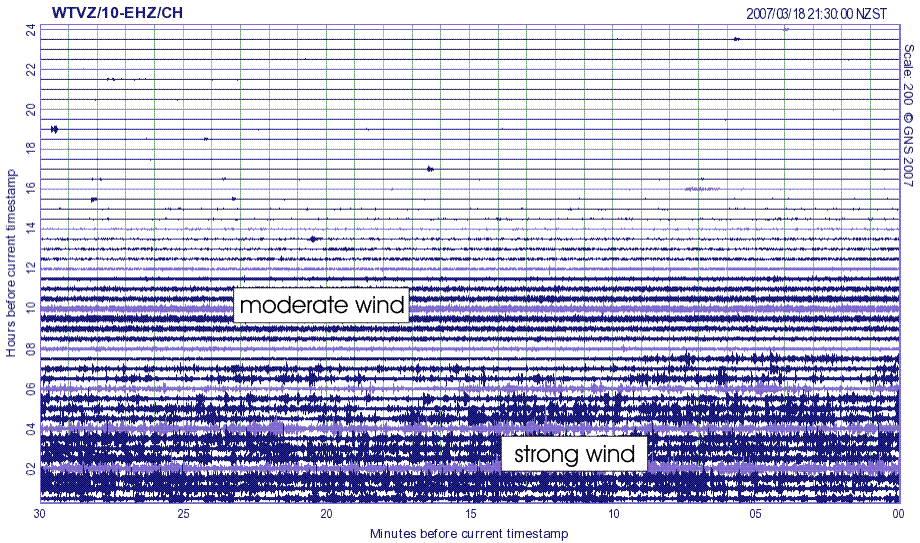
In Fig. 5 wind noise is noticeable between about 13 and 8 hours previously, then there is a short calmer period
before a stronger wind starts (around 7 hours previously) and continues until the end of the seismogram.
Hide caption
Figure 5: Typical wind noise on a seismic record.
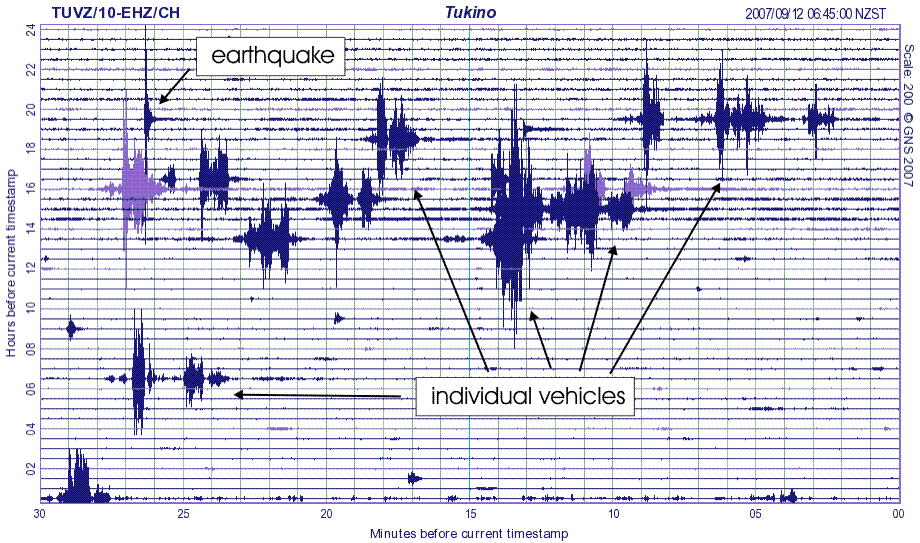
In some cases individual vehicles can be seen and in other cases there are so many vehicles that the ground
vibrates continuously and looks like wind:
In Fig. 6, we can see individual vehicles going by Tukino (TRVZ) on Mount Ruapehu;
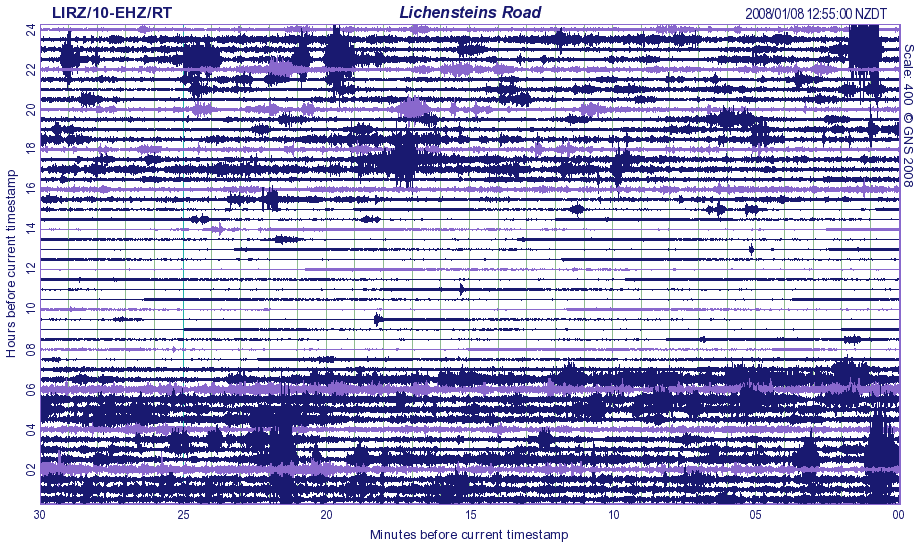
Near Rotorua, where daily traffic produces a lot of ground noise (see Fig. 7), we see a continuous vibration
signal at Lichenstein Road (LIRZ).
Hide caption
Figure 6: Noise from individual vehicles.
Hide caption
Figure 7: Traffic produces a lot of ground noise and makes volcano monitoring difficult.
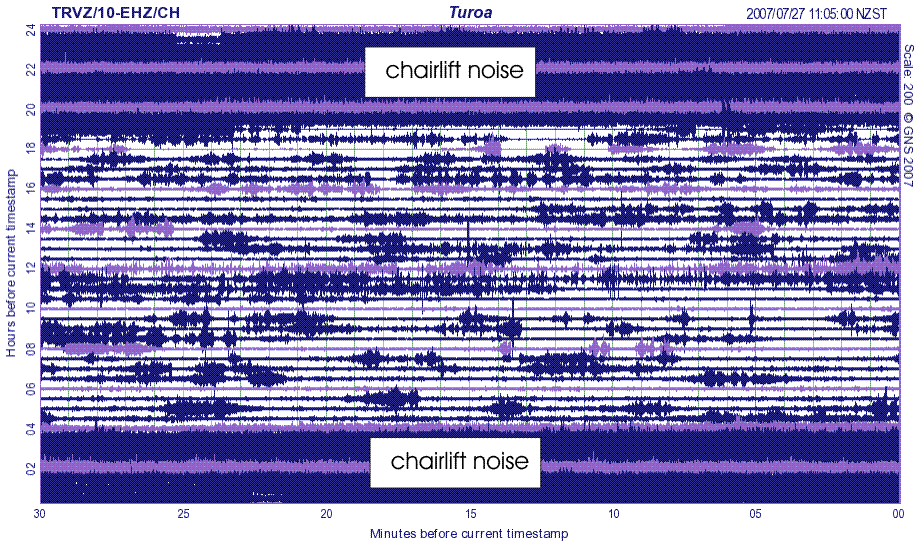
Other sites sometimes show noise that is particular to that site. Examples include seismographs on Mount Ruapehu
that record noise produced by skifield chair lifts (see Fig. 8).
Hide caption
Figure 8: Noise originating from the Turoa skifield chair lifts.
Seismic Drums Images
These images are used to appraise the frequency of local earthquakes and the level of ground tremor at a volcano.
The production of these images is computationally intensive so there is no guarantee that the images are available for every site, nor that the style of the images will stay the same. A typical set of images for a volcano monitoring site are:
The above URLs point to the latest images for the seismometer at site HBAZ. As long as we need to produce images for this site and there is a seismometer at the location then the URLs are valid.
For more information about each seismic site, including opening and any closing dates, see our DELTA database. You may also wish to view the seismic network maps or read about how we interpret these images.