
Live tsunami gauge data
View tsunami gauge data from the last 36 hours. You can see de-tided and sea level data for all tsunami gauge sensors on the GeoNet network in one graph.

View tsunami gauge data from the last 36 hours. You can see de-tided and sea level data for all tsunami gauge sensors on the GeoNet network in one graph.
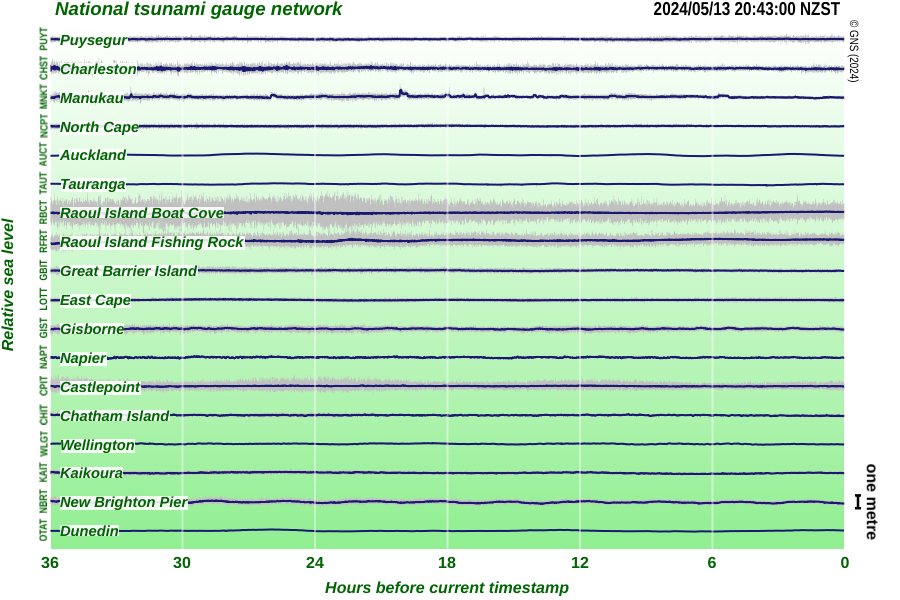
De-tided Tsunami Gauge Chart
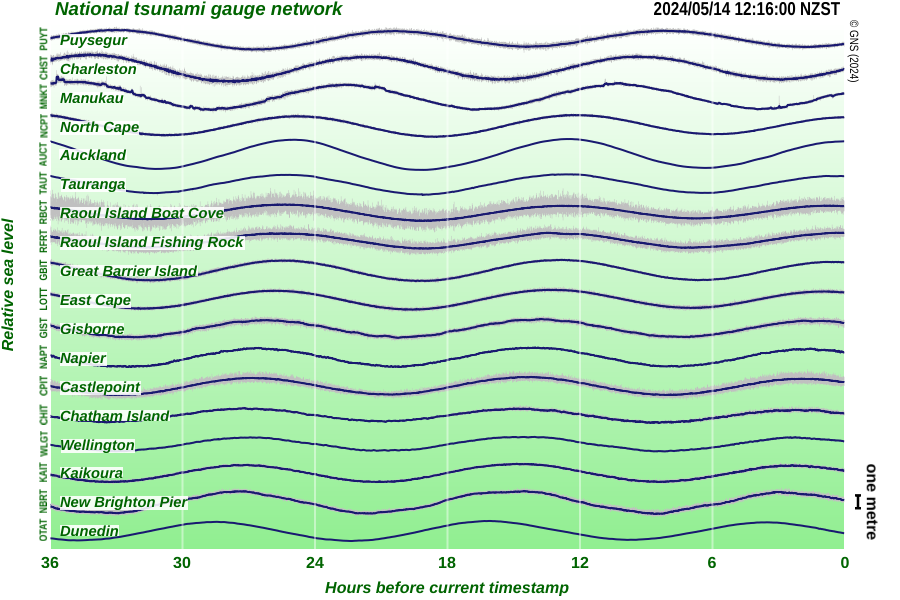
Sea Level Tsunami Gauge Chart
The timestamp shown at the top right of the images is the time when the images were last refreshed. The previous 36 hours of sea level variations from all operational sites are displayed, oldest to most recent from left to right. Within the sampling period of one minute, the dark part of the trace shows the average sea level height, whilst the grey part shows the maximum and minimum values.